In my Python class last quarter, our final project involved using BeautifulSoup to pull in data from a site and analyze it using methods we’d learned throughout the quarter. I chose to look at data on the top-250 rated beers on BeerAdvocate, which is probably the most known beer review/rating site on the internet.
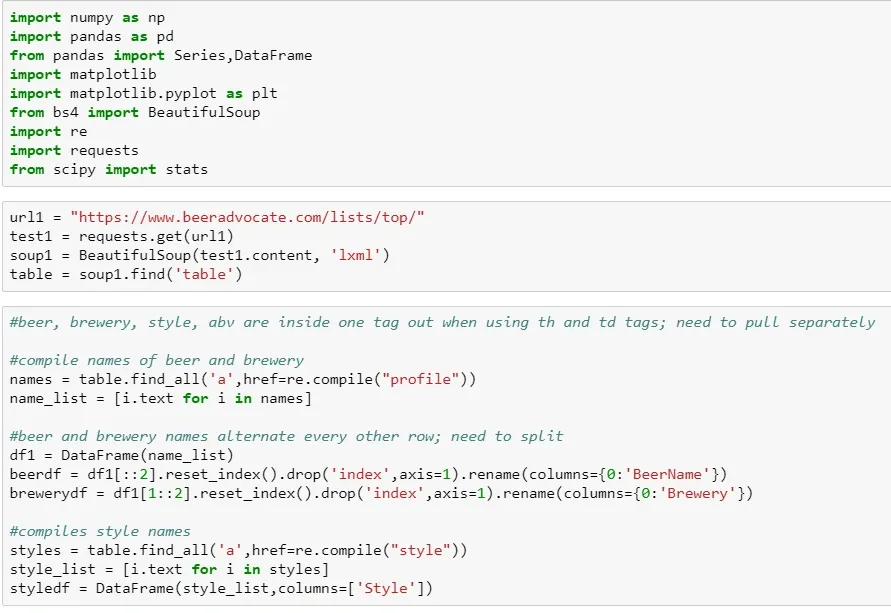
I started by scraping the HTML data, which involved a combination of easy table locations, text parsing, and character removal to give me the best data for analysis. (This code is at the bottom of the post because it’s less fun than pretty graphs)
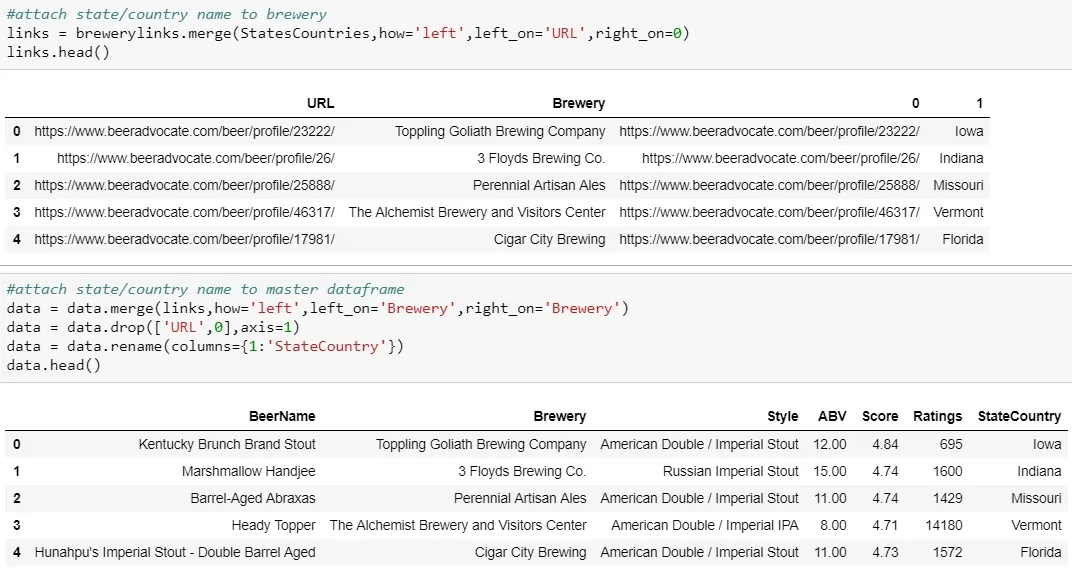
Once I had clean data compiled, the fun could begin:
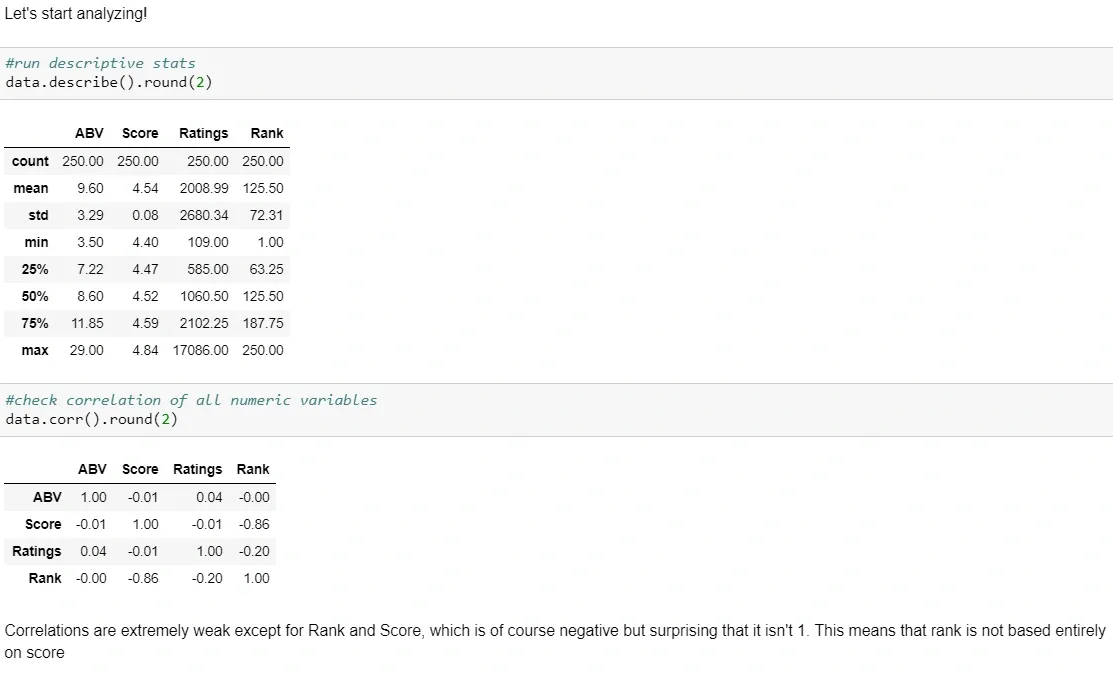
As a good analyst, I started with some descriptive statistics and correlations. Correlations are pretty weak among our numeric variables, except for rank and score which are obviously negatively correlated. But it was interesting to see that this correlation was not -1. There are apparently other factors that influence ranking besides just the score.
Then I built a couple tools to get back information of interest from the data. You can find out the information of a beer at a given ranking, or return all beers from two states for comparison. I like these are easy ways to give an end user access to this data without having to dig for it on their own. 
And what analysis would be complete without those graphs I mentioned earlier?
A bar graph by style is unsurprising for beer folks - the top styles are imperial IPAs and imperial stouts; together these two styles represent nearly half of the top-250! 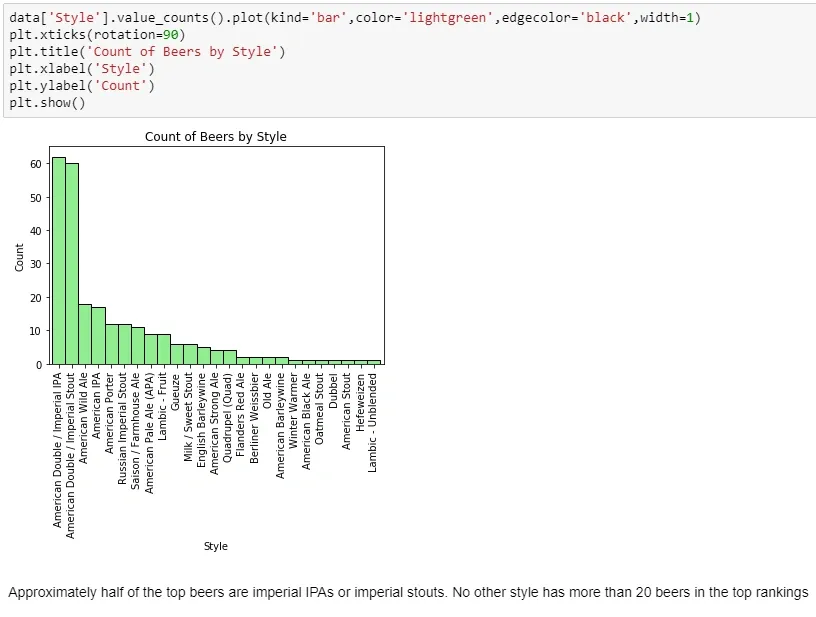
Planning your next beer-cation? Head for the coasts - California and Massachusetts/Vermont 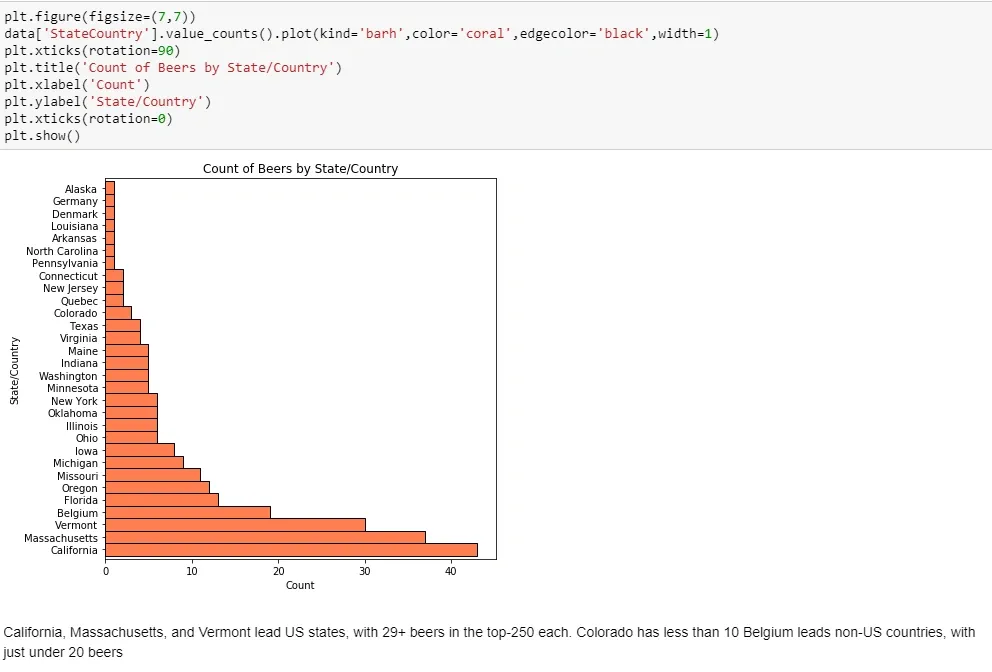
That Massachusetts and Vermont dominance is led by three breweries: Hill Farmstead in VT and Trillium and Tree House in MA. Each has over 15 breweries in the top-250, while no other brewery even has 10. So while the Northeast might be a little top-heavy, California is more balanced. Excuse me while I book a flight. 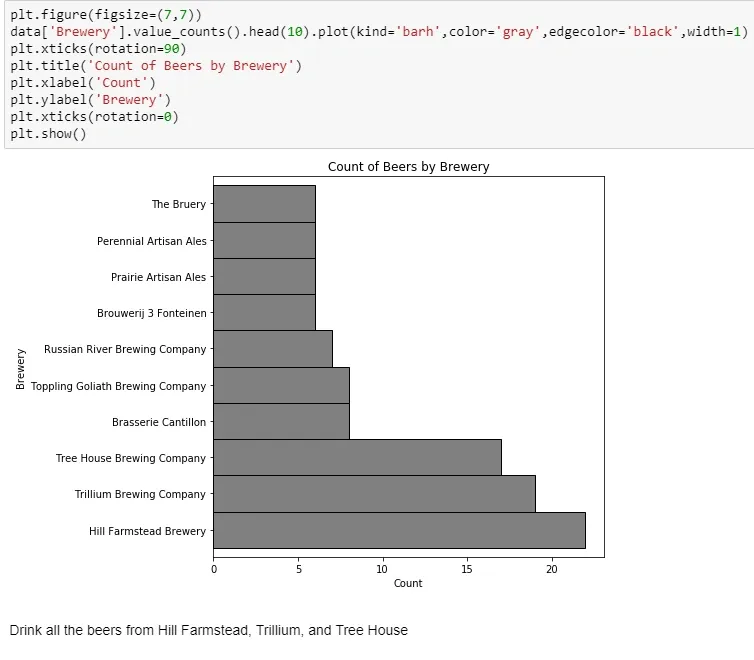
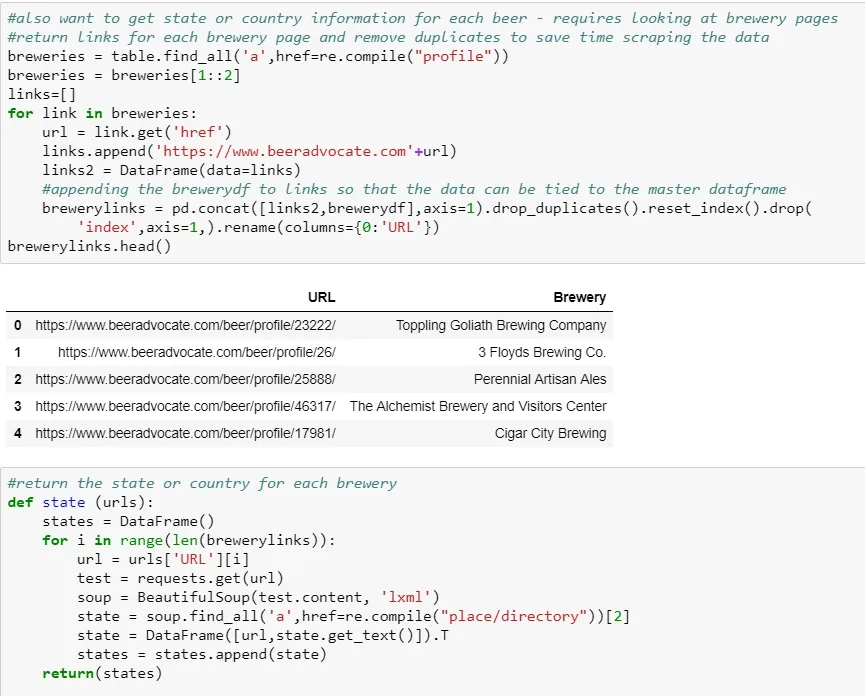
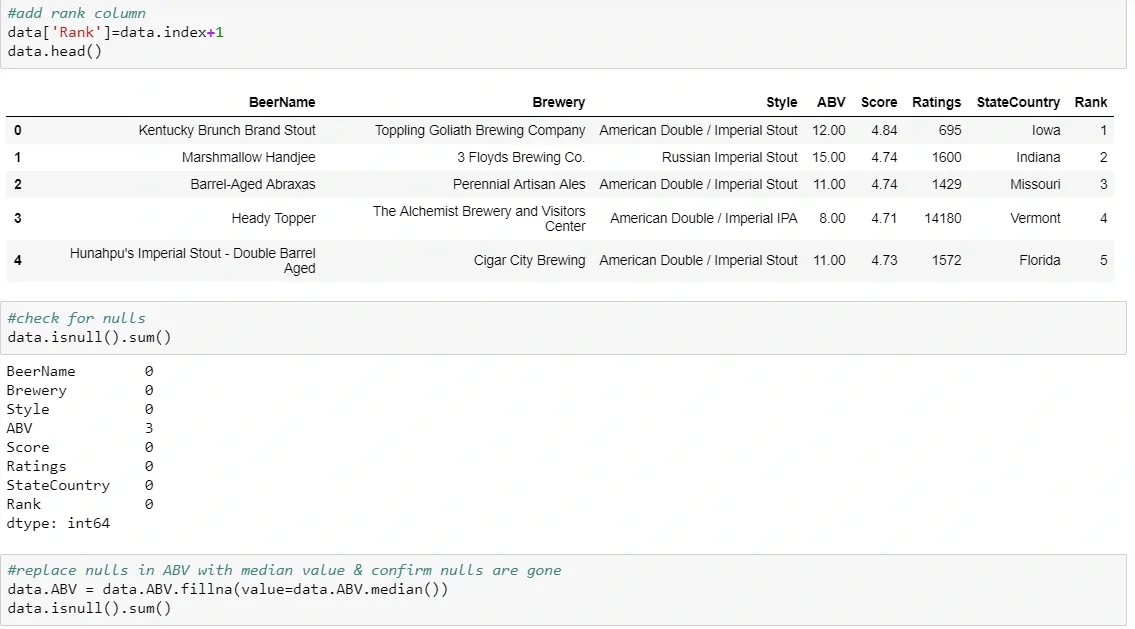
Scraping Code Breakdown