Baseball people won’t shut up about position players pitching. The opinions range from “this is fun and weird” to “please just stop.” The light bulb for me was when multiple games had position players throwing multiple innings. I’ve seen these articles and the graphs within, but I haven’t actually found an official source that tracks this stat so I made my own.
Using Fangraphs’ defensive leaderboards, I was able to pull all defensive positioning data going back to 1961 (a mostly arbitrary cutoff). From there I just narrowed the list of everyone down to those who had pitching and non-pitching records, then removed the pitchers who had played the field (maybe this is phase 2 since I just saw the Rays’ closer play third in a 1-run game yesterday), and voila!
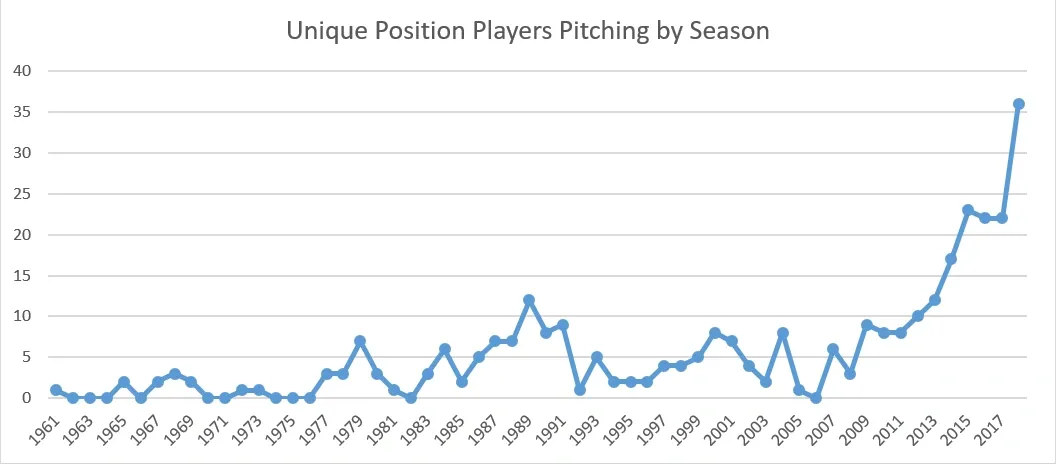
A mostly flat line, consistently under 15 and then 2014 hits and that starts climbing. 2015 broke past 20 and the purists were probably sweating it pretty hard, but then things leveled off (phew) until BAM we’re past 35 different position players throwing in 2018 with 40% of the season left.
As starters continue to throw fewer innings (avg 5.5 IP/start this season vs 6.1 in 1998) bullpens have been increasingly tapped to make up the difference. Whether this strategy is coming from the front office or the dugout is unclear, but there is definitely a greater willingness to preserve the full-time pitchers in games that are well out of hand. The only question left is this - where does it stop?