All baseball has been talking about for the past few years has been the rise of home runs.
So I wanted to see for myself what the pace of home runs looks like this year. I found this code for working with BB Ref box scores and made some changes to better suit my needs.
I thought that working with box scores would give me the most flexibility in analyzing all kinds of trends throughout the year. For this project, I aggregated home runs for every game through the All-Star break.
Using Retrosheet’s game log files, I trended home runs through the same number of games in each season going back to 2010:
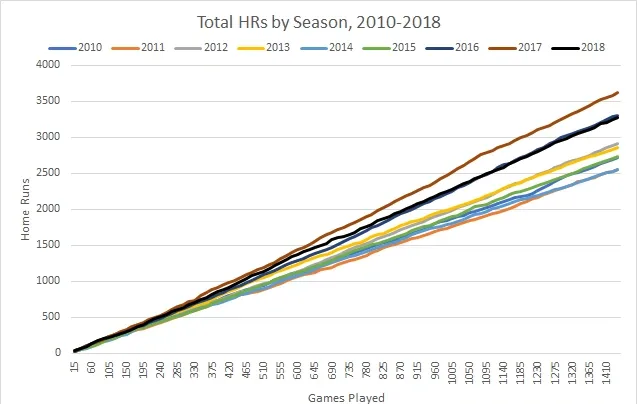
At this point in the season, it seems clear that we’re on the decline from Peak HRs™. This season is pacing right in line with 2016 (which is still a massive HR year in the scheme of things) and well below the 2017 season. Halfway through the season the home run total is down 9% vs last year.
Early in the year there were theories that bad weather in the Northeast and Midwest (exemplified by the large number of postponed games) were to blame for suppressing home runs. This season started early than any other in the past decade, so maybe we should drop those early months and look at a slightly more “fair” comparison from May through the All-Star Break.
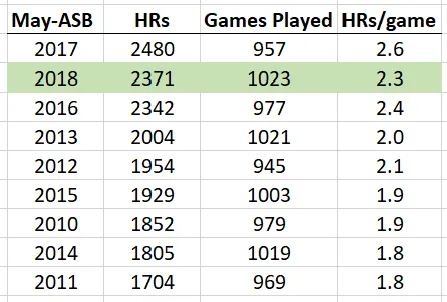
The ASB fell more than a week later this year, so while the gap between this year and last is smaller in absolute terms, on a per game basis this year is still lagging.
So weather is no longer enough to explain this difference. Are pitchers adapting? Is the ball changing again? Sounds like a topic for next time.
Code breakdown
Packages used: 
- To pull from each game individually, we need the URL to the box score and the list of tables to reference. Luckily, baseball reference has a consistent syntax for their URLs so I was able to build out the logic in Excel with limited effort.

-
Then we get to the actual pulling of the data. As I mentioned, most of this code was adapted from Ben Kite’s work on GitHub. Basically we are using BeautifulSoup to find the underlying HTML code, then locating the code for the two tables referenced in the dictionary. From there it’s just a matter of picking out the right columns. I opted for using the pitching tables because they provide an easy total of home runs. Home runs are not included in the hitting table, but as notes below it, which requires more parsing to get the total. At the end I am basically just reformatting everything so that I get one row per game and I can see which team was charged with which runs/HRs.
- I readily admit that this could be cleaned up quite a bit, but it gets the job done in a relatively short amount of time and gives me the ability to run analyses at different cuts of time, team, etc