President Obama started the “Every Kid in a Park” program on 9/1/2015. This program allows all 4th graders and their families to get into National Parks (and Monuments, Forests, etc) for free. After a recent trip to Wind Cave National Park in South Dakota where we saw several families get tours for free under this program, Amanda suggested I find some data to learn about the impact of the program. I don’t expect to see any attendance growth from this program until summer 2016 when kids are out of school, since many do not live close enough to parks to visit outside of breaks and 2/3 of NP visits happen between May & September
To measure the impact, I looked at “recreation visits” from 1979-2017 from the NPS site here. Unfortunately, this appears to be the most granular form of visit reported (nothing on annual passes, senior passes, 4th graders, etc), so my analysis is fairly high-level and directional.
Spoiler alert: I didn’t find anything, but still found some cool things in the data.
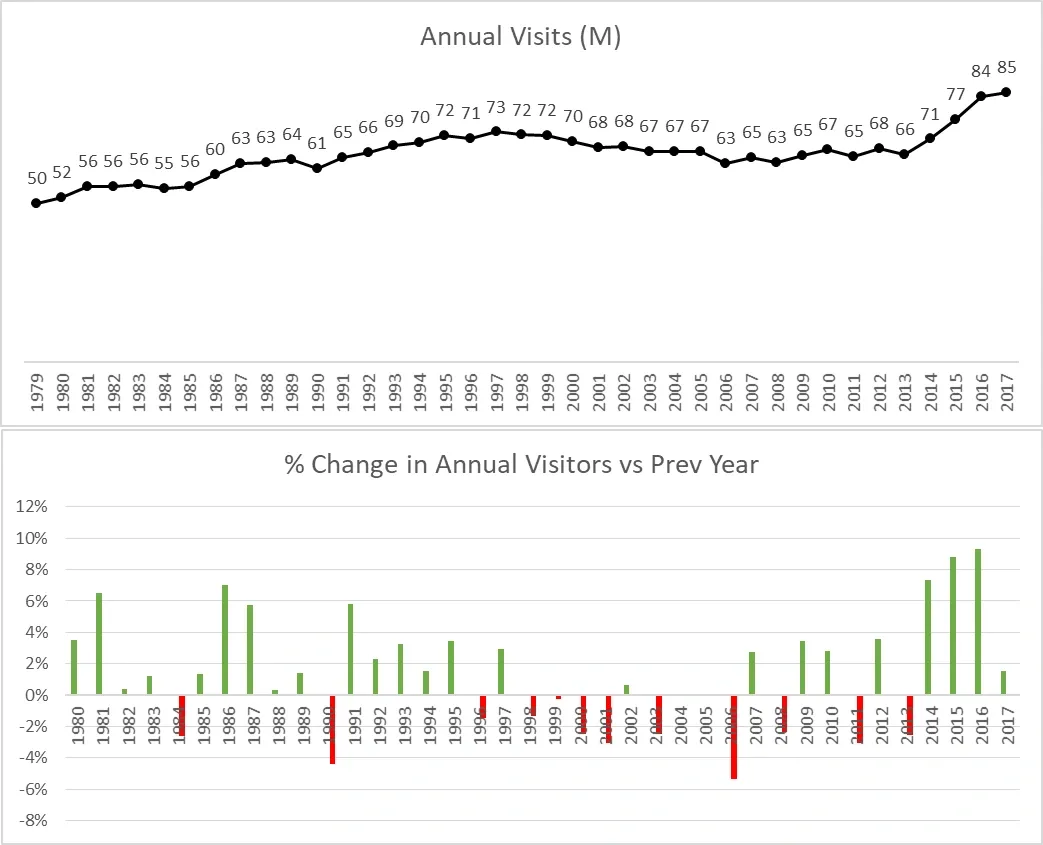
Annual visits
While annual visits did increase by 9% from 2015-2016, this appears to be part of a trend that started a few years earlier. In fact, 2014 increased +7% vs 2013, the largest YoY percentage increase in this dataset (since 1979-80) at that point in time. 2014-16 have been the largest single YoY growth years in this timeframe and the first time that there have been three consecutive years of growth since the mid-1990s. The annual data does not provide any information that suggests the program contributed to recent visit growth.
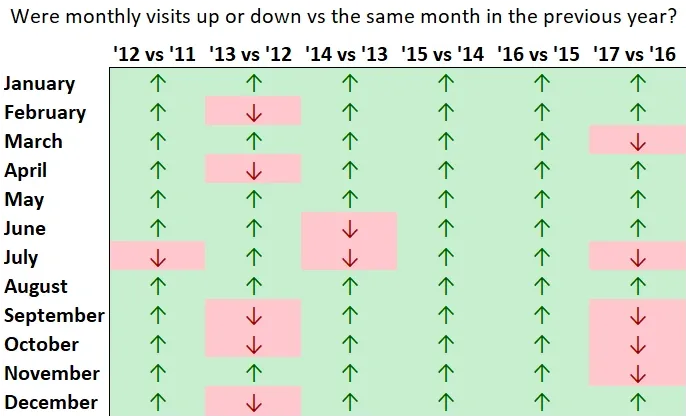
Monthly
Drilling down to the monthly level, all months in 2015 and 2016 had more visits vs the same month in the respective previous year. This supports the idea of a longer-term trend not attributable to this program. The longer trend dating back to 2011 shows that visits in May and August have increased every year – these are months that I would expect to see increased 4th grader visits under this program.
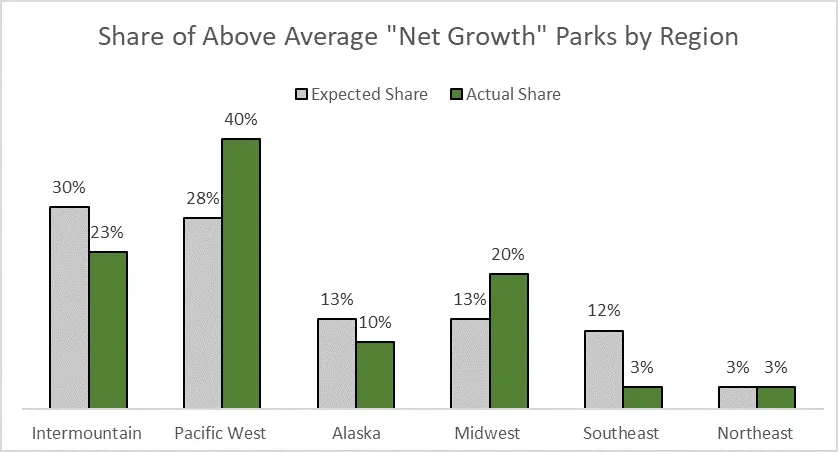
Parks/Regions
Finally, I looked at the park and region level with the thought that some parks may benefit from this program more than others. For this analysis I calculated the average of the 2014-13 and 2015-14 annual changes and the 2016-15 and 2017-16 annual changes and took the difference. A positive difference indicates higher average growth in the post-EKIAP years than in the two years preceding the program. Across all parks, the pre-growth averaged 8% vs 5% post, for a net of -3%. Half of the 60 National Parks have a net growth above the aggregate.
Parks in the Pacific West and Midwest regions over-index as above average net growth parks, suggesting that they may be seeing greater increases in attendance via this program. On the flip side, the Intermountain and Southeast regions under-index and may not be attracting as many 4th grade families as they could.
Below are the top- and bottom-five parks for net change in attendance in recent years. It’s interesting that three of the bottom-five parks are in the Pacific West region, despite this region being the most over-performing in the above average group.
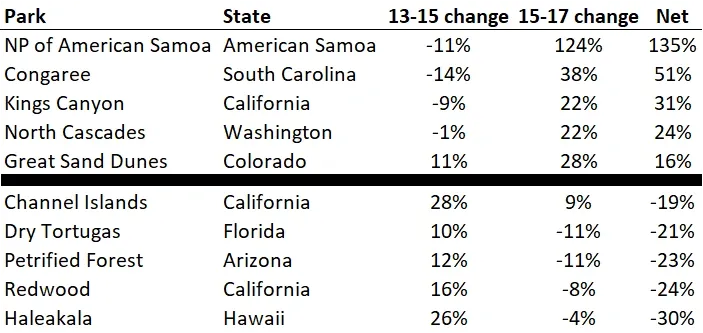
One other interesting note at the park level: the top-six parks by attendance in 2017 (Great Smoky Mountains, Grand Canyon, Zion, Rocky Mountain, Yosemite, and Yellowstone) all saw net change at or below the overall NP level.
Conclusion
There is no clear evidence that the EKIAP has itself lead to more National Park visits overall, though there are some signs that West Coast and Midwest parks have benefitted. Obviously, there are plenty of other possible reasons for this growth; the important thing for the NPS is that visits are still at a record high in 2017 and continue to see strong growth.
Next Steps
Next steps for investigating this question would be accessing any data specific to park attendance via this program. While I was able to find a few statistics on number of passes downloaded, I couldn’t find any specific park visit data for 4th graders and their families. Hopefully this is being collected somewhere by the NPS to assess effectiveness of the program.
Another step could be to bring in additional data that could explain yearly and monthly fluctuations in attendance. A broader analysis could help strip out other factors that have driven up NP attendance and provide a (slightly) clearer picture of the impact of this program.